You can determine when your business stops losing money and begins to turn a profit by using break even analysis. It displays the quantity of units you must sell or the amount of money you must make in order to pay for all of your expenses.
When you’re planning growth, changing prices, or launching a new product, this calculation is essential. It provides you with a specific goal and indicates the financial viability of your concept.
Before making important decisions, a lot of small business owners use break-even analysis. You can estimate when you’ll start making money and comprehend your risks with a few easy formulas. We describe the definition of break-even analysis, how to compute it, and how to apply it to more intelligent planning in this guide.
💡 Plan Smarter with Kladana ERP
✔️ In the Finance module of Kladana, you’ll find income and expense reports that allow you to calculate the break-even point with high accuracy. This gives you a clear picture of when your business starts to cover costs, and how to plan further growth.
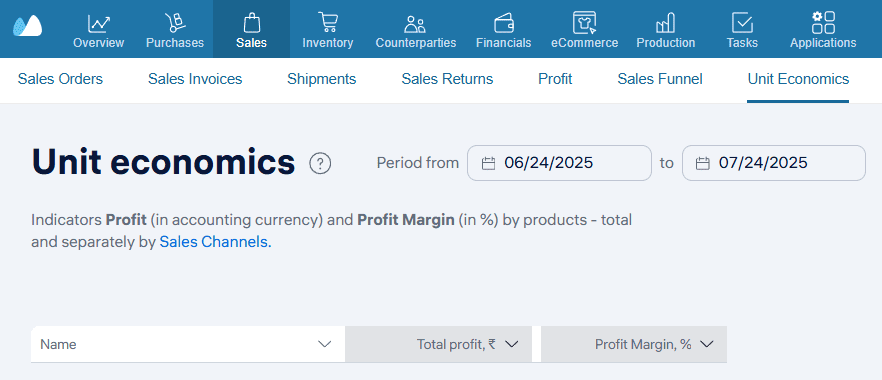
✔️ In the Sales module, you can calculate unit economics for each product. Calculating unit economics from the beginning can save your business from costly mistakes, help you calculate profits, and determine whether it is reasonable to join the market with a given product.
What Is Break Even Analysis?
Break even analysis is a financial tool that answers a basic but critical question: At what point does my business stop losing money and start earning it?
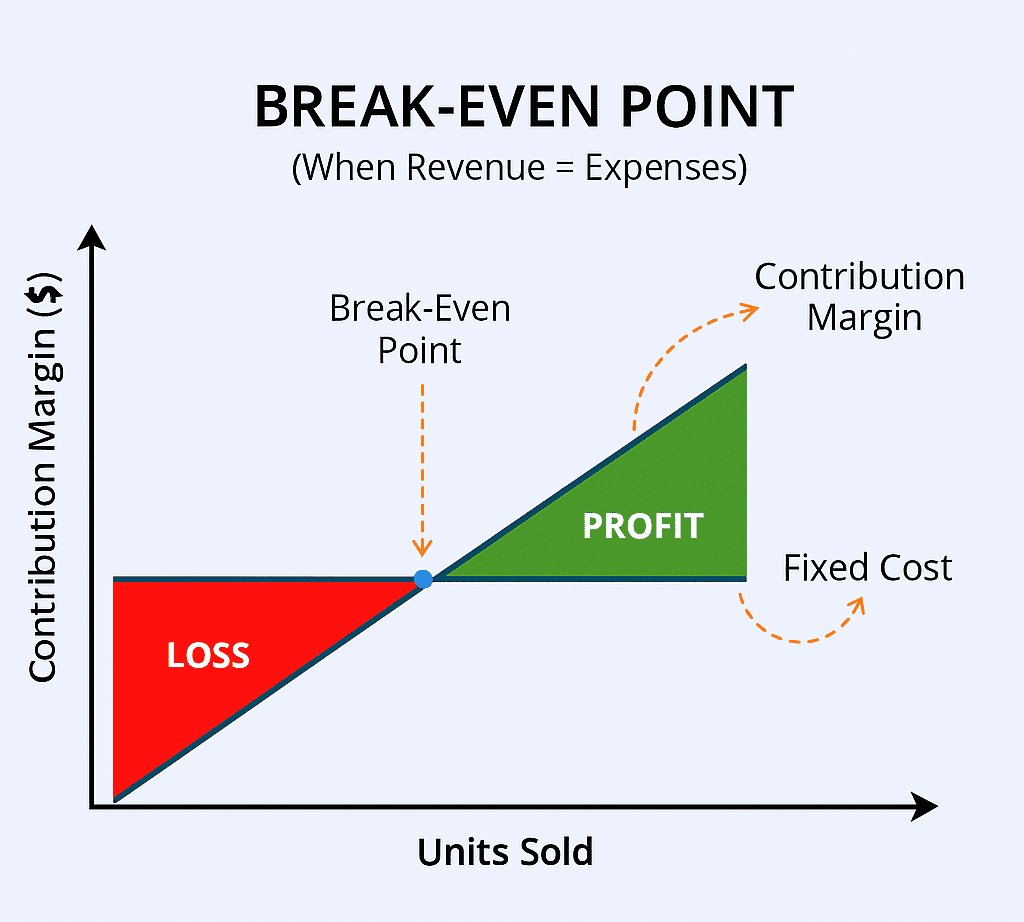
The analysis compares your fixed and variable costs with your sales revenue. By calculating this balance point called the break even point (BEP) you can plan prices, sales goals, and cost reductions more effectively.
🧮 Use the Free Break-Even Point Calculator
Want to skip manual formulas and get your break-even instantly?
- Enter your fixed costs, variable cost per unit, and selling price
- See your break-even quantity and revenue immediately Kladana
- Test different scenarios to plan pricing, cost structure, and scale with confidence
Perfect for product launches, cost control, or setting realistic sales targets
This isn’t just an accounting formula. It’s a way to test your business model and see whether your idea is likely to work before you invest too much money or time.
Why Break Even Analysis Matters for Businesses
For small businesses and startups, every decision counts. Break even analysis helps you:
- Set realistic sales targets — so you know what “success” means in numbers
- Plan smarter pricing — by checking if your prices cover costs and generate profit
- Avoid cash burn — by spotting unprofitable products or high fixed costs early
- Support funding pitches — by showing investors that your idea has financial logic
You can use break even analysis before launching a product, expanding to new markets, or investing in equipment. It turns rough guesses into informed decisions.
Key Assumptions Behind Break Even Analysis
These are some of the basic assumptions of break even analysis that keep the calculation simple:
Costs are split into fixed and variable
Fixed costs (like rent or salaries) stay the same regardless of output. Variable costs (like raw materials) change with each unit produced.All units are sold
The model assumes that everything you produce gets sold — with no leftover stock.Prices stay constant
It assumes your selling price doesn’t change over time or across customers.Production efficiency is stable
No major changes in how much it costs to make each unit.
🔊Attention! These assumptions help simplify the math, but in real life, it’s important to revisit the numbers when conditions change.
Break Even Formulas Explained
Break even analysis uses a few simple formulas to calculate how much you need to sell to reach the break even point. You may make calculations in units or in money. The results may help you turn your cost and revenue numbers into visible targets.
Let’s go through the key break even formulas one by one.
Break Even Point Formula
You can apply the BEP formula to calculate how many units you need to sell to cover your fixed and variable costs.
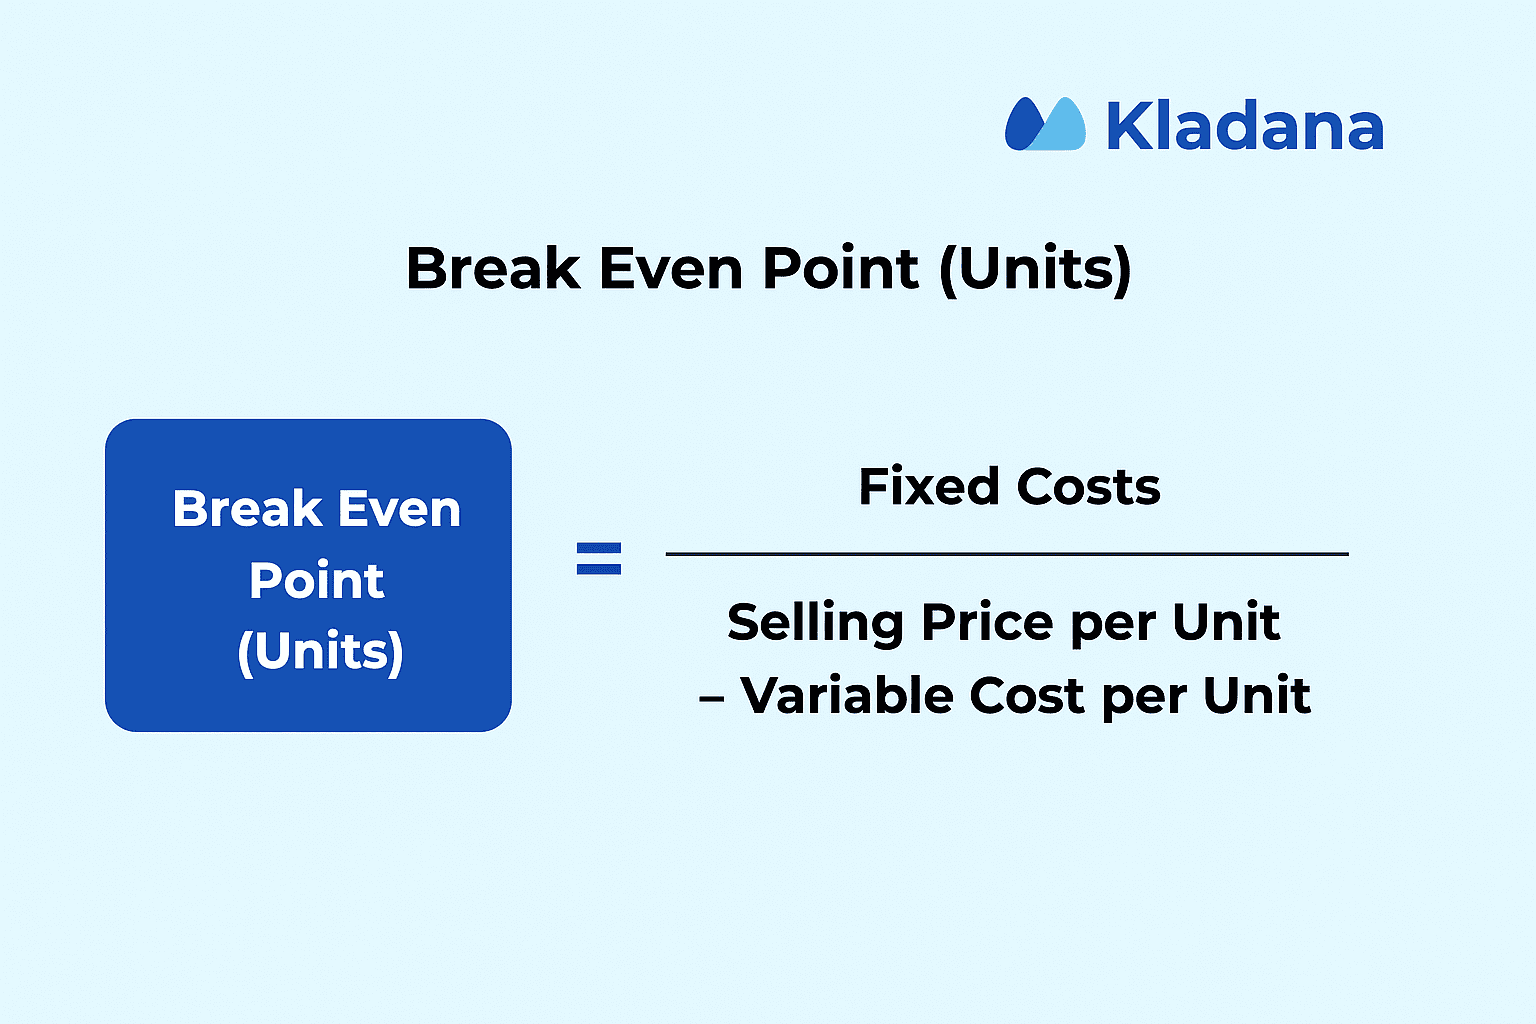
The amount that remains from each sale after deducting variable costs is known as the contribution margin per unit, and it is shown in brackets.
Break Even Sales Formula
The BEP sales formula gives you a revenue target instead of a unit target:
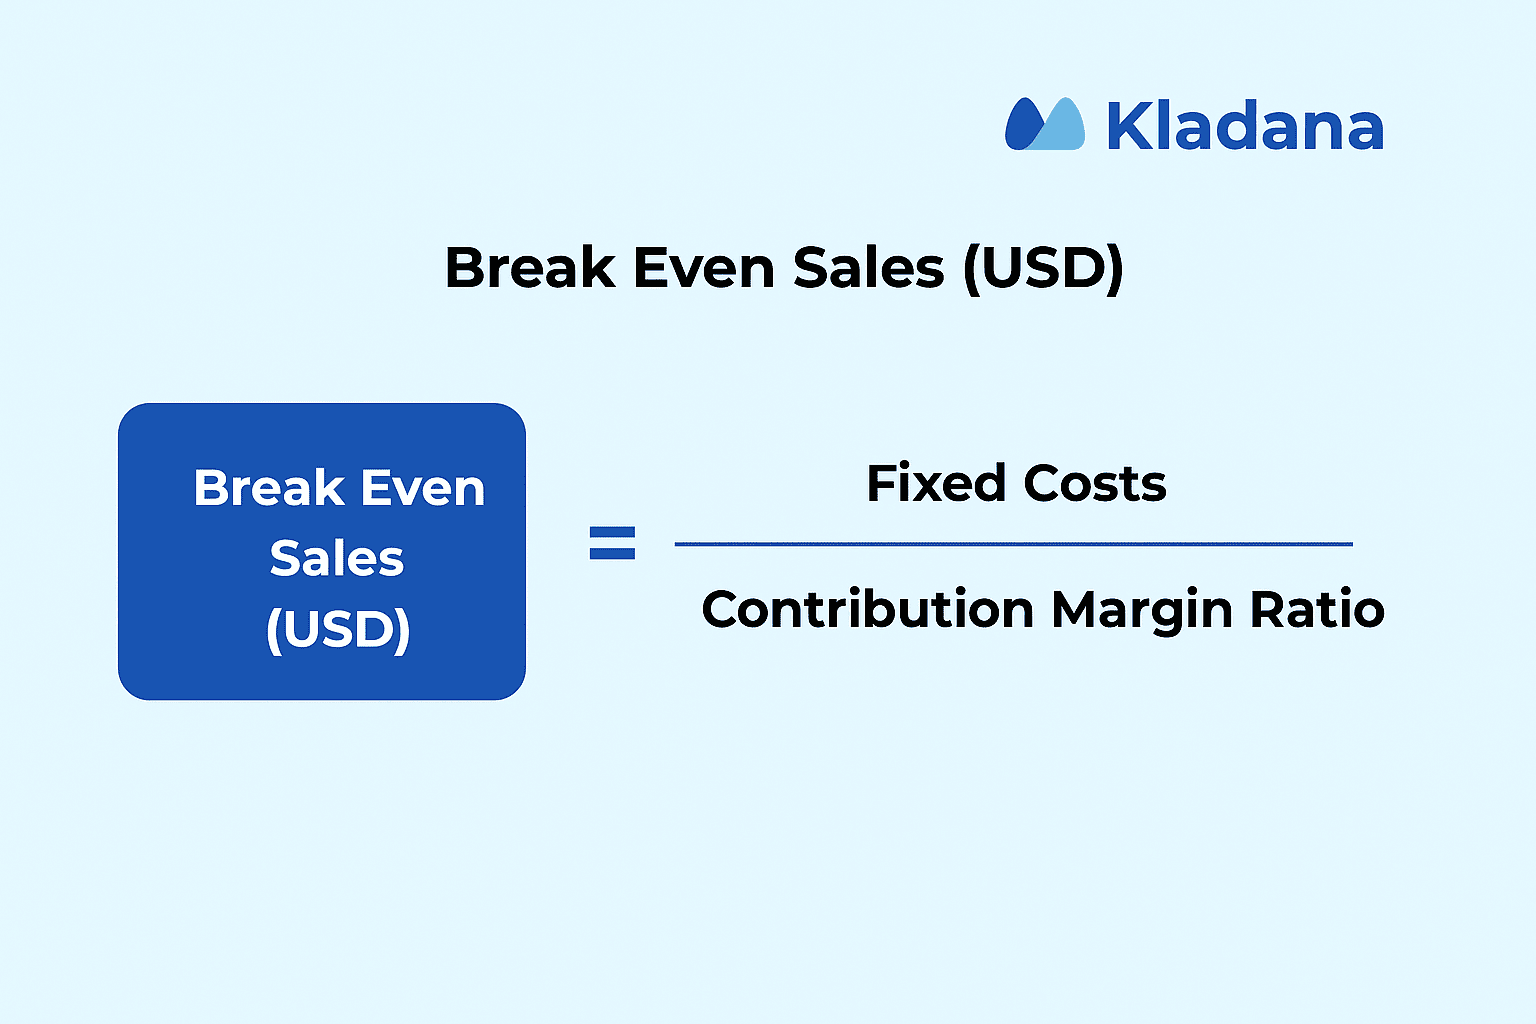
Where:
Contribution Margin Ratio = (Selling Price — Variable Cost) ÷ Selling Price
This tells you how much total revenue you need to generate to break even.
Break Even Quantity Formula
This is another name for the break even point in units. It’s often used in manufacturing or inventory-heavy businesses.

Use it when you want a clear number of products or services to target.
Example Calculations
Assume:
- Fixed costs = $600
- Selling price per unit = $6.00
- Variable cost per unit = $3.60
Step 1: Contribution margin per unit
$6.00 − $3.60 = $2.40
Step 2: Break even quantity
$600 ÷ $2.40 = 250 units
Step 3: Break even sales
250 units × $6.00 = $1,500
Or using the formula:
Contribution margin ratio = $2.40 ÷ $6.00 = 0.4
Break even sales = $600 ÷ 0.4 = $1,500
So, you need to sell 250 units or earn $1,500 in revenue to break even.
How to Perform a Break Even Analysis
Accounting professionals are not the only ones who can use break-even analysis. It can be used by any startup team, product manager, or founder to test a business idea or enhance pricing. To begin, all you need are your selling price, variable costs, and fixed costs.
Here is a step-by-step guide to doing it.
Step-by-Step Process of Break Even Analysis
1. Enumerate every fixed expense.
These costs, which include rent, salaries, software subscriptions, and insurance, are constant regardless of sales volume.
2. Determine the unit’s variable costs
These expenses, which include raw materials, packaging, and delivery charges, vary depending on the product or service sold.
3. Decide on a selling price.
Decide on the average price you want to charge for your goods or services.
4. Calculate the contribution margin
Selling price — Variable cost per unit = Contribution margin per unit
5. Apply the break even formulas
Use one of the formulas:
- Break even quantity = Fixed costs ÷ Contribution margin per unit
- Break even sales = Fixed costs ÷ Contribution margin ratio
6. Examine various scenarios
To observe how your break-even point changes, change the price, cost, or volume. This is helpful in your planning for periods of high and low sales.
💡 Tip: Use detailed BOMs to break down unit costs, avoid misallocating overheads, and improve your analysis.
Common Pitfalls and Mistakes
Steer clear of these common mistakes that could produce deceptive results:
- Ignoring unstated expenses
Your break-even point will be skewed if you ignore costs like transaction fees, returns, or waste.
- Making assumptions rather than doing calculations
You may get irrational results if you use approximate numbers for prices or costs.
- Combining variable and fixed costs
Make it clear which costs are fixed and which vary with volume.
- Considering every product to be equal
If you sell multiple items with different prices and costs, calculate BEP for each separately or use weighted averages.
- Ignoring discounts or taxes
Real revenue and margins may be severely affected by these.
Using Break Even Analysis in Business Planning
Break even analysis is more than a financial tool. It can guide smarter decisions across pricing, product development, and cost planning. When used regularly, it helps you avoid expensive mistakes and improves your chances of making a profit.
Pricing Decisions
If your break even point is too high, your price might be too low or your costs too high. You can test different price levels to see how many sales are needed to cover costs.
For example, a small increase in price can reduce the number of units you need to sell. At the same time, you must consider how this change could affect customer demand.
This method also helps set your minimum viable price. You’ll know the lowest price that keeps your business from losing money.
New Product Launches
Before launching a product, use break even analysis to check if the idea makes financial sense. Ask yourself:
- How many units must I sell to cover my investment?
- Can I reach this target with my current resources?
- What if the product doesn’t sell as expected?
Cost Structure Planning
Break even analysis shows how your costs affect your profits. You can decide whether to reduce fixed costs or cut variable costs per unit.
For example:
- Choosing a more affordable supplier
- Outsourcing production or packaging
- Renting instead of buying equipment
With Kladana’s built-in cost tracking and sales forecasting, you can automatically figure out when you’re breaking even and see how pricing or volume fluctuations affect your profits.
Break Even Analysis vs Margin of Safety
The minimum sales required to prevent losses are determined by break-even analysis. The amount that your actual or anticipated sales surpass that break-even point is indicated by your margin of safety. When combined, they provide a more comprehensive understanding of business risk.
Key Differences
- Break Even Point: The sales level at which total expenses and total income are equal. No gain, no loss.
- Margin of Safety: The buffer between actual or anticipated sales and the break-even point
Both are helpful in understanding risk. “When do we start making money?” is answered by break-even analysis. “How much can sales drop before we lose money?” is the question posed by margin of safety.
Quick Example
Let’s say:
- Break even sales = $1,500
- Expected sales = $2,200
Margin of Safety = $2,200 − $1,500 = $700
This means your sales can fall by $700 before you start losing money. A high margin of safety means lower risk. A low one means you’re operating close to the edge. Use both tools together to make better pricing, sales, and cost decisions.
Recommended read: Explore essential costing methods for manufacturing and inventory
Frequently Asked Questions on Break Even Analysis
Here are clear answers to common questions from entrepreneurs, students, and financial planners. Each answer is written in simple terms with practical examples.
What is break even analysis in simple words?
It’s a way to find out how much you need to sell to cover your costs. Once you reach that level, you’re no longer losing money — you’re breaking even.
How do I calculate the break even point?
Use this formula:
Break even quantity = Fixed Costs ÷ (Selling Price − Variable Cost per Unit)
You can also calculate break even sales using the contribution margin ratio.
What is the formula for break even sales?
Break even sales = Fixed Costs ÷ Contribution Margin Ratio
Where:
Contribution Margin Ratio = (Selling Price − Variable Cost) ÷ Selling Price
What assumptions are made in break even analysis?
- All products are sold (no unsold stock)
- Costs are clearly divided into fixed and variable
- Prices and costs stay the same
- Business runs at a steady level of efficiency
Is break even analysis only for products?
No. You can use it for services too. Just calculate your cost to deliver one unit of service and apply the same formulas.
How often should a business run a break even analysis?
At least once per quarter, or before launching a product, changing prices, or taking on big expenses. Align your break even calculations with proper production planning for stronger results.
What is the difference between break even quantity and break even sales?
- Break even quantity = number of units to sell
- Break even sales = total revenue to earn
Both tell you how much is needed to break even, just in different formats.
Can you do a break even analysis for services?
Yes. Use your average service cost and price just like you would for products. The logic is the same.
What costs are included in break even calculations?
Include:
- Fixed costs (rent, salaries, tools)
- Variable costs (materials, packaging, shipping per unit)
Exclude:
- One-time costs like equipment purchases
Loan repayments (unless interest is part of fixed costs)
How does break even analysis help in decision-making?
It helps you:
- Set prices that actually cover costs
- Decide whether to continue or stop a product
- Plan sales goals and marketing budgets
- Avoid risky financial decisions
To Sum It Up
You can determine when your company will turn a profit and stop losing money by using breakeven analysis. The basic idea behind it is to balance your total revenue and expenses. Every next sale generates actual profit after this point is reached.
Using fixed costs, variable costs, and selling price, you can determine your break-even point in either revenue or units. These formulas are simple to use and can help you make better decisions about everything from pricing and product launches to cost structure adjustments.
One of the best resources for financial planning for small businesses is break-even analysis. It helps you avoid pricing mistakes, gives you a clear sales target, and indicates when a novel idea might be too risky.
