
A monthly maintenance report format in Excel helps teams record repair work, inspections, service dates, costs, and pending tasks in one file. It gives facility managers, technicians, and supervisors a clear monthly view of asset condition and maintenance workload.
You can use this report for buildings, machines, production equipment, vehicles, utilities, or any other assets that need regular service. A good Excel format also helps spot repeated breakdowns, missed preventive checks, and high repair costs before they become bigger problems.
This guide explains what to include in a monthly maintenance report, how to create one in Excel, and which free templates you can use for different maintenance needs.
- What Is a Monthly Maintenance Report?
- Why Use Excel for Monthly Maintenance Reports?
- Key Elements of a Monthly Maintenance Report Format
- Types of Monthly Maintenance Report Formats in Excel
- How to Create a Monthly Maintenance Report in Excel
- Download Free Monthly Maintenance Report Templates
- Best Practices for Maintenance Reporting
- When Excel Is Enough — and When You Need ERP
- FAQs on Monthly Maintenance Report in Excel
- To Sum It Up
What Is a Monthly Maintenance Report?
A monthly maintenance report is a record of all maintenance work completed, pending, or planned during a month. It shows what was checked, what was repaired, who did the work, how much it cost, and what still needs attention.
🏭 For example, a small furniture factory can use a monthly maintenance report to track saw servicing, compressor repairs, HVAC checks, spare parts used, and pending repair jobs.
A property management firm can use the same format to track plumbing, electrical work, elevator checks, and cleaning issues.
Monthly maintenance reports are common in:
- manufacturing units;
- warehouses;
- office buildings;
- residential properties;
- schools and hospitals;
- utility and service teams;
- hotels and commercial facilities.
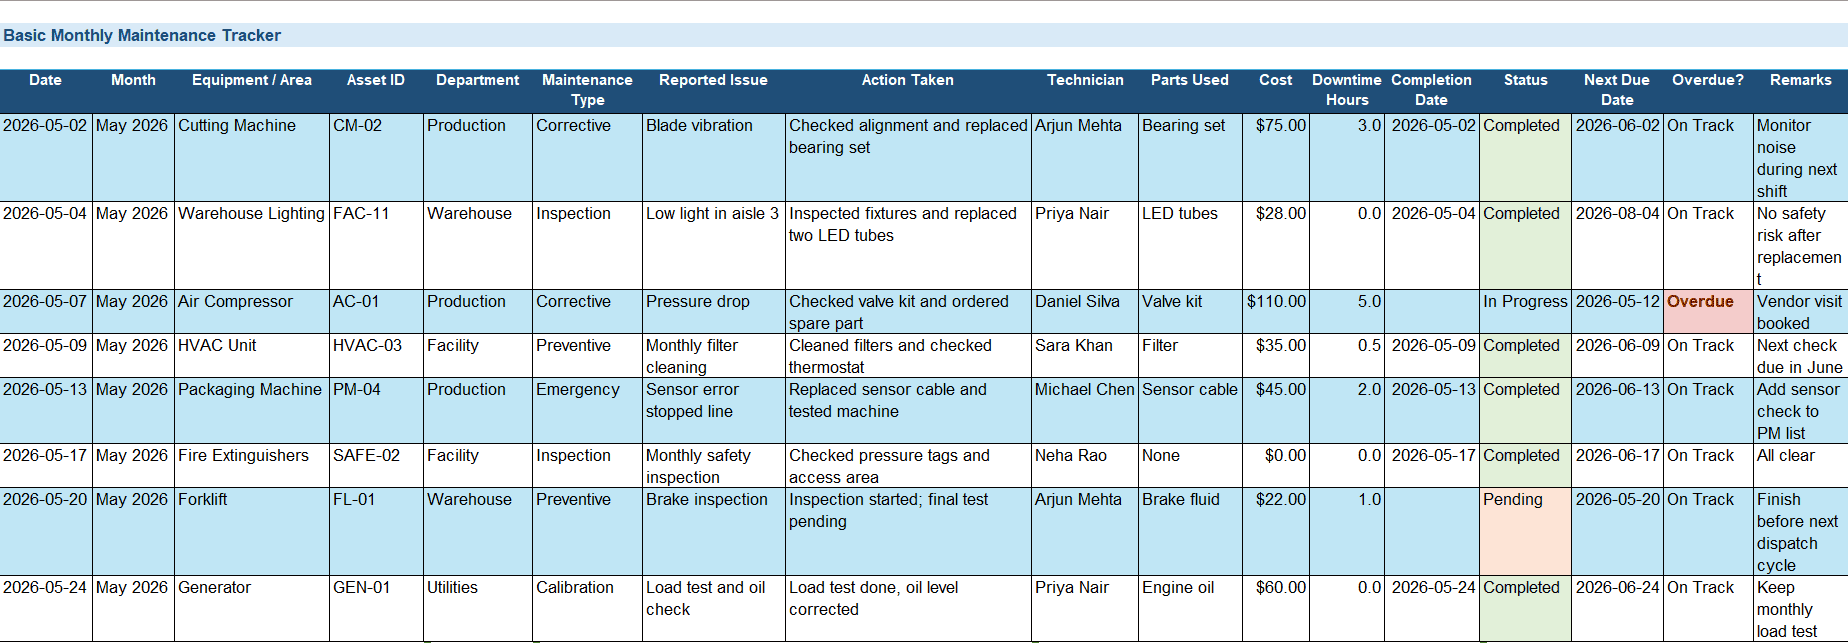
Excel is often the first tool teams use for this work. It is easy to edit, familiar to most users, and flexible enough for different maintenance formats. Teams can start with a simple maintenance log sheet Excel file and later add formulas, filters, charts, and dashboards.
A monthly report is different from a daily log. A daily log records each task as it happens. A monthly report summarizes that data so managers can review performance, costs, overdue jobs, and asset condition.
Need More Ready Excel Templates?
Maintenance reports are only one part of daily business tracking. Many teams also use spreadsheets for stock, production, payroll, delivery, quality checks, and fixed assets.
Kladana has a collection of free Excel templates for small businesses. You can use them to organize routine work faster and keep records in a clear format.
Explore templates for:
- inventory tracking;
- daily stock records;
- production reports;
- delivery challans;
- attendance and payroll;
- fixed assets;
- quality inspection.
Why Use Excel for Monthly Maintenance Reports?
Excel works well for small and mid-sized teams that need a simple way to organize maintenance data. It does not require special training, and most teams can adapt the sheet to their own workflow.
You can create separate tabs for equipment, building maintenance, preventive checks, repair costs, and monthly summaries. This keeps all maintenance data in one workbook instead of scattered notebooks, messages, and separate files.
Excel also supports basic automation. You can use formulas to calculate total maintenance cost, task completion rate, overdue jobs, and cost per equipment. This saves time during monthly reviews.
🏭 For example, a maintenance supervisor can filter the report by technician, status, department, or asset type. They can see which machines had the most repairs, which jobs are still pending, and how much was spent on spare parts.
Excel is useful for:
- monthly service reports;
- preventive maintenance checklists;
- equipment maintenance trackers;
- building service logs;
- repair and inspection records;
- maintenance cost summaries;
- asset maintenance dashboards.
The main limit is scale. Excel works well while the team is small and the maintenance process is simple. Once maintenance data must connect with inventory, spare parts, production schedules, purchase orders, and sales deadlines, dedicated software or ERP becomes easier to control.
Key Elements of a Monthly Maintenance Report Format
A good report should be simple enough for technicians to fill in and detailed enough for managers to review. The fields below cover most maintenance tracking needs.
| Field | Description |
| Date / Month | Reporting month or exact date of the maintenance activity. |
| Equipment / Area | Name, code, location, or area maintained. |
| Maintenance Type | Preventive, corrective, inspection, calibration, or emergency repair. |
| Reported Issue | Fault, breakdown, defect, leakage, noise, damage, or service request. |
| Action Taken | Work performed by the technician or maintenance team. |
| Technician Name | Person responsible for the task. |
| Parts Used / Cost | Spare parts, consumables, labor cost, or total repair cost. |
| Completion Date | Date when the work was completed. |
| Status | Completed, Pending, In Progress, or On Hold. |
| Remarks | Notes, next due date, safety concern, or follow-up action. |
For small teams, these fields are enough to create a clear monthly service report Excel file. For larger teams, you can add asset ID, department, priority, downtime hours, vendor name, invoice number, and approval status.
A stronger report can also include a short monthly summary at the top of the sheet:
| Summary Metric | Example |
| Total Tasks | 48 |
| Completed Tasks | 41 |
| Pending Tasks | 5 |
| Overdue Tasks | 2 |
| Total Maintenance Cost | $1,850 |
| Highest-Cost Asset | Packaging Machine 02 |
| Total Downtime | 14 hours |
This summary helps managers see the month’s maintenance performance without checking every row manually.
Types of Monthly Maintenance Report Formats in Excel
There is no single maintenance report format that fits every team. A building manager needs to track service areas and safety issues. A production supervisor needs machine condition, downtime, spare parts, and repair costs. A preventive maintenance planner needs due dates and task completion.
Below are the main Excel formats that cover most monthly reporting needs.
Building Maintenance Report Excel
A building maintenance report Excel template helps track repair and service work across a facility. It is useful for offices, warehouses, shops, apartment buildings, schools, hotels, and commercial properties.
Use it to record:
- electrical checks;
- plumbing repairs;
- HVAC service;
- lift maintenance;
- cleaning issues;
- fire safety checks;
- lighting repairs;
- water leakage;
- pest control;
- general facility work.
A building maintenance sheet usually includes the service area, issue description, priority, assigned technician, completion date, cost, and status. This format works best when you need a clear building service log for monthly facility reviews.
💡 Example:
| Date | Area | Issue | Action Taken | Priority | Cost | Status |
| May 5 | 2nd Floor | AC not cooling | Cleaned filter and checked gas level | Medium | $35 | Completed |
| May 9 | Parking Area | Light not working | Replaced LED fitting | Low | $18 | Completed |
| May 16 | Pantry | Water leakage | Pipe joint replaced | High | $42 | Pending Review |
Equipment Maintenance Report Format
An equipment maintenance report tracks service work for machines, tools, vehicles, and production assets. It is useful for factories, workshops, warehouses, food units, textile units, packaging teams, and repair teams.
Use it to record:
- asset name;
- asset ID;
- machine location;
- breakdown details;
- owntime hours;
- parts used;
- technician name;
- repair cost;
- next service date.
This format helps managers see which machines break down most often and which assets cost the most to maintain.
💡 Example:
| Equipment | Asset ID | Issue | Downtime | Parts Used | Cost | Status |
| Cutting Machine | CM-02 | Blade vibration | 3 hours | Bearing set | $75 | Completed |
| Air Compressor | AC-01 | Pressure drop | 5 hours | Valve kit | $110 | In Progress |
| Packing Machine | PM-04 | Sensor error | 2 hours | Sensor cable | $45 | Completed |
This type of equipment maintenance tracker is especially useful for manufacturing teams because machine downtime can delay production and customer orders.
Preventive Maintenance Report Format
A preventive maintenance report shows planned checks and servicing tasks for the month. It helps teams avoid breakdowns instead of reacting after equipment fails.
Use it for:
- lubrication;
- calibration;
- cleaning;
- inspection;
- filter replacement;
- safety checks;
- machine alignment;
- electrical panel checks;
- scheduled servicing.
A preventive maintenance format Excel file should include the task name, frequency, planned date, actual completion date, assigned person, status, and next due date.
💡 Example:
| Asset | Preventive Task | Planned Date | Completed Date | Next Due Date | Status |
| Generator | Oil level check | May 3 | May 3 | Jun 3 | Completed |
| HVAC Unit | Filter cleaning | May 7 | May 8 | Jun 7 | Completed |
| Forklift | Brake inspection | May 12 | — | Jun 12 | Pending |
This format is useful for teams that often miss preventive maintenance deadlines or depend on manual reminders.
Maintenance Cost Summary
A maintenance cost summary helps managers review monthly spending by department, asset, technician, or maintenance type. It is useful when repair costs are rising but no one knows the exact reason.
Use it to track:
- labor cost;
- spare parts cost;
- vendor service cost;
- total cost by asset;
- total cost by department;
- preventive vs corrective cost;
- monthly repair trends.
💡 Example:
| Department | Preventive Cost | Corrective Cost | Parts Cost | Total Cost |
| Production | $220 | $640 | $310 | $1,170 |
| Warehouse | $95 | $180 | $80 | $355 |
| Facility | $140 | $130 | $55 | $325 |
This report helps answer simple but important questions: Which area costs the most? Which equipment needs repeated repair? Are preventive checks reducing breakdowns?
Maintenance Cost & Performance Dashboard
A dashboard turns maintenance data into a quick monthly view. It can be a separate Excel sheet connected to the main maintenance log.
A simple dashboard can show:
- total tasks;
- completed tasks;
- pending tasks;
- overdue tasks;
- total maintenance cost;
- completion rate;
- downtime hours;
- cost by equipment;
- tasks by technician;
- preventive vs corrective work.
💡 Example:
| KPI | Monthly Result |
| Total Maintenance Tasks | 52 |
| Completed Tasks | 45 |
| Pending Tasks | 5 |
| Overdue Tasks | 2 |
| Completion Rate | 86.5% |
| Total Cost | $2,430 |
| Total Downtime | 19 hours |
This format is useful for managers who do not need every repair detail but need a clear maintenance summary report at the end of each month.
How to Create a Monthly Maintenance Report in Excel
You can build a useful report with one main log sheet and one summary sheet. Start simple. Add formulas and charts only after the basic structure works.
Step 1: Create the Main Maintenance Log
Open a new Excel workbook and create a sheet named Monthly Maintenance Log.
Add these headers in the first row:
| Column | Header |
| A | Date |
| B | Month |
| C | Equipment / Area |
| D | Asset ID |
| E | Department |
| F | Maintenance Type |
| G | Reported Issue |
| H | Action Taken |
| I | Technician |
| J | Parts Used |
| K | Cost |
| L | Downtime Hours |
| M | Completion Date |
| N | Status |
| O | Remarks |
| P | Next Due Date |
This structure works for equipment, building, and preventive maintenance reports. You can remove columns that your team does not need.
Step 2: Add Dropdown Lists
Dropdowns keep the sheet clean and reduce spelling mistakes. They also make filters and reports more accurate.
Useful dropdowns include:
| Column | Dropdown Options |
| Maintenance Type | Preventive, Corrective, Inspection, Calibration |
| Department | Production, Warehouse, Facility, Admin |
| Status | Completed, Pending, In Progress, On Hold |
| Priority | Low, Medium, High, Critical |
In Excel, select the cells, go to Data → Data Validation → List, and enter the options separated by commas.
For example, for Status:
Completed, Pending, In Progress, On Hold
Step 3: Add Basic Formulas
Formulas help you calculate monthly totals without manual work.
Total Maintenance Cost
=SUM(K2:K100)
Use this formula when the Cost column is in column K.
Total Downtime Hours
=SUM(L2:L100)
This helps track how many hours equipment or service areas were unavailable.
Completed Tasks %
=COUNTIF(N2:N100,”Completed”)/COUNTA(N2:N100)
Format the result as a percentage.
Pending Tasks
=COUNTIF(N2:N100,”Pending”)
In Progress Tasks
=COUNTIF(N2:N100,”In Progress”)
Overdue Tasks
=COUNTIFS(P2:P100,”<“&TODAY(), N2:N100,”<>Completed”)
This formula counts tasks where the next due date has passed and the task is not completed.
Step 4: Add Conditional Formatting
Conditional formatting helps users spot urgent work faster.
Useful rules:
| Rule | Suggested Highlight |
| Status = Pending | Light warning fill |
| Status = In Progress | Neutral fill |
| Status = Completed | Success fill |
| Next Due Date < Today and Status is not Completed | Strong warning fill |
| Cost above monthly limit | Strong warning fill |
For example, you can highlight overdue tasks by selecting the Next Due Date column and using a formula rule:
=AND($P2<TODAY(),$N2<>“Completed”)
This makes overdue maintenance easy to find during weekly reviews.
Step 5: Use Filters for Quick Review
Turn the header row into a filter table. Select the data range and press Ctrl + T.
Then filter by:
- month;
- department;
- technician;
- maintenance type;
- status;
- equipment;
- cost.
This is useful when a manager wants to review only pending factory maintenance, only HVAC jobs, or only high-cost equipment repairs.
Step 6: Create a Monthly Summary Sheet
Create a second sheet named Monthly Summary.
Add KPI cards or a small table with key numbers:
| Metric | Formula Example |
| Total Tasks | =COUNTA(‘Monthly Maintenance Log’!A2:A100) |
| Completed Tasks | =COUNTIF(‘Monthly Maintenance Log’!N2:N100,”Completed”) |
| Pending Tasks | =COUNTIF(‘Monthly Maintenance Log’!N2:N100,”Pending”) |
| Overdue Tasks | =COUNTIFS(‘Monthly Maintenance Log’!P2:P100,”<“&TODAY(), ‘Monthly Maintenance Log’!N2:N100,”<>Completed”) |
| Total Cost | =SUM(‘Monthly Maintenance Log’!K2:K100) |
| Total Downtime | =SUM(‘Monthly Maintenance Log’!L2:L100) |
This summary gives managers a quick monthly view without checking each maintenance record.
Step 7: Add a PivotTable or Chart
A PivotTable helps you group data by department, equipment, technician, or maintenance type.
Useful PivotTable views include:
| View | Purpose |
| Cost by Equipment | Find expensive assets |
| Tasks by Technician | Review workload |
| Status by Department | Find pending work |
| Downtime by Equipment | Spot production risks |
| Maintenance Type by Month | Compare preventive and corrective work |
A simple chart can show monthly cost, completed vs pending tasks, or downtime by asset.
For small teams, one or two charts are enough. Too many charts can make the file harder to maintain.
Connect Maintenance Data with Production Control
Excel helps with monthly reports. Kladana helps manufacturers control stock, production stages, costs, and orders in one place.
Download Free Monthly Maintenance Report Templates
You can use one Excel workbook with separate sheets for different maintenance needs. This keeps the file simple and helps managers compare monthly data across buildings, machines, departments, and technicians.
Below are four free monthly maintenance report templates that work for small businesses, factories, warehouses, service teams, and facility management teams. The templates are grouped in one workbook. Select the sheet you need.
Basic Monthly Maintenance Tracker
Use this template if your team needs one simple report for all maintenance activities.
This template is the easiest starting point. It can replace a notebook or a scattered set of messages. It also gives managers a clear monthly record of completed and pending jobs.
Best for: small businesses, workshops, warehouses, and office maintenance teams.
Equipment Maintenance Report Format
Use this template to track machines, tools, vehicles, and production equipment.

This format helps production teams find repeated breakdowns. For example, if the same packaging machine needs repairs three times in one month, the manager can plan deeper inspection or replacement.
Best for: manufacturing units, repair teams, warehouses, and production supervisors.
Building Maintenance Log Sheet
Use this template to track building service work and facility upkeep.

A building maintenance report Excel sheet helps property managers and facility teams keep a monthly record of service quality, repair cost, and open issues.
Best for: offices, residential buildings, hotels, schools, shops, and commercial properties.
Preventive Maintenance Summary Sheet
Use this template to plan and review scheduled checks before breakdowns happen.
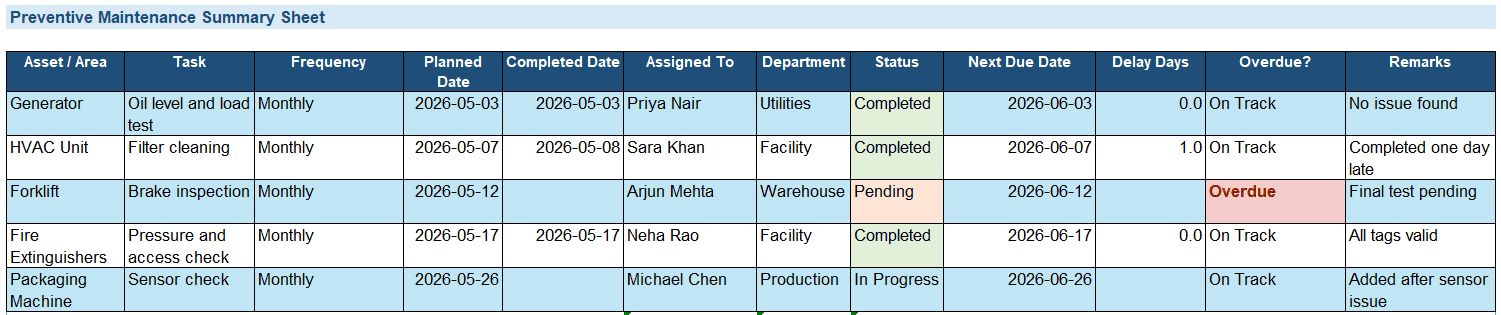
This template works as a simple preventive maintenance checklist and monthly summary. It helps teams see which checks were completed and which tasks are late.
Best for: teams that need to track recurring maintenance tasks and service deadlines.
Maintenance Cost & Performance Dashboard
Use this dashboard to turn maintenance records into a clear monthly summary.
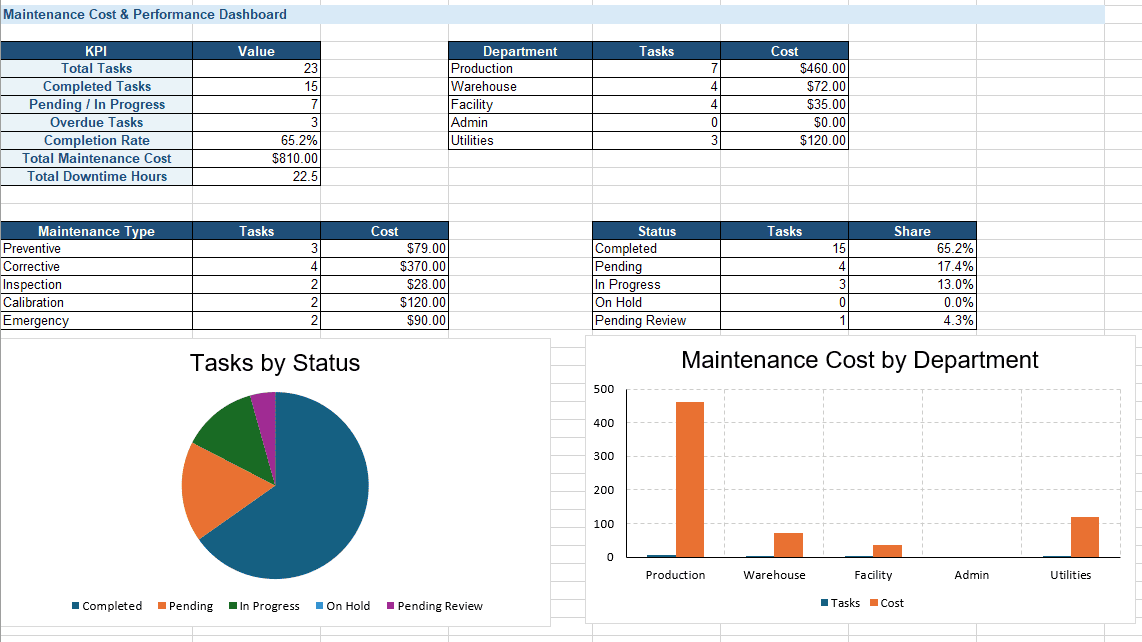
This sheet is useful for monthly meetings. Instead of reading every maintenance record, managers can review the main KPIs in one place.
Best for: managers who need a short monthly maintenance summary report.
Best Practices for Maintenance Reporting
A monthly maintenance report is useful only when the data is complete and consistent. A clean Excel file can help, but the team still needs simple reporting rules.
Use the Same Format Every Month
Keep the same column names and dropdown options across all months. This makes it easier to compare data and create PivotTables.
For example, do not write Done, Completed, and Closed for the same status. Use one value: Completed.
Record Maintenance Work Immediately
Ask technicians to update the sheet right after the task is done. Late updates often lead to missing costs, wrong dates, and unclear repair notes.
A short note is better than no note. For example: “Changed belt, tested machine, next check in June.”
Review Pending Jobs Every Week
Do not wait until the end of the month to check pending tasks. Review open maintenance work each week.
This helps prevent small issues from turning into breakdowns. It also helps managers plan spare parts, technician time, and vendor visits.
Track Both Cost and Downtime
A low repair cost can still hide a serious problem if the equipment stops production for many hours.
Track both:
- repair cost;
- downtime hours.
This gives a more accurate view of the real maintenance impact.
Keep Historical Records
Save each month’s report in the same folder and use clear file names.
Example:
monthly-maintenance-report-may-2026.xlsx
Historical records help you compare costs, repeated faults, seasonal issues, and technician workload.
Protect Formulas
Lock formula cells in the summary and dashboard sheets. This prevents accidental edits.
You can keep input cells unlocked so technicians can still fill in maintenance data.
Use Dropdowns Instead of Free Text
Dropdowns make reports easier to filter and analyze.
Use dropdowns for:
- status;
- department;
- maintenance type;
- priority;
- technician name;
- asset category.
This small setup makes the report cleaner and reduces manual fixes later.
When Excel Is Enough — and When You Need ERP
Excel is enough when your team has a small number of assets, a simple maintenance process, and one or two people updating the file.
It works well if you only need to track:
- monthly service records;
- repair costs;
- pending tasks;
- preventive maintenance dates;
- basic equipment downtime.
But Excel becomes harder to manage as your business grows. Problems usually appear when maintenance data needs to connect with stock, spare parts, purchase orders, production schedules, and customer deadlines.
For example, a manufacturer may track a machine repair in Excel but manage spare parts in another sheet. Production orders may sit in a third file. Sales orders may be tracked in a separate system. This creates delays and mistakes.
That is when ERP can help.
Still Managing Production and Maintenance Data in Separate Sheets?
Excel works for monthly maintenance reports. But manufacturers also need to control raw materials, production stages, finished goods, costs, and orders.
Kladana ERP helps small manufacturers manage inventory, production, sales, purchases, and finances in one system. It is useful when spreadsheets no longer give enough control over daily operations.
FAQs on Monthly Maintenance Report in Excel
Here are short answers to the common questions teams ask before they start using a monthly maintenance report format in Excel.
What Details Should a Maintenance Report Include?
A maintenance report should include the date, asset name, issue, maintenance type, action taken, technician name, cost, completion date, status, and remarks. For equipment maintenance, also add asset ID, downtime hours, parts used, and next service date.
Can Excel Automatically Track Maintenance Schedules?
Yes. Excel can track maintenance schedules with due dates, formulas, filters, and conditional formatting. You can highlight overdue tasks and count pending jobs automatically. For more complex reminders, you may need calendar alerts, Excel scripts, or maintenance software.
How Do I Calculate Maintenance Costs per Department?
Add a Department column and a Cost column. Then use a PivotTable to summarize total cost by department. You can also use the SUMIF formula if you want a simple department-based summary.
Example:
=SUMIF(E2:E100,”Production”,K2:K100)
How Often Should Monthly Maintenance Reports Be Reviewed?
Review pending and overdue jobs weekly. Review the full report at the end of each month. This helps managers check costs, downtime, repeated faults, and preventive maintenance completion.
Can Excel Automatically Calculate Maintenance Completion Rates?
Yes. Use COUNTIF to count completed tasks and divide it by the total number of tasks.
Example:
=COUNTIF(N2:N100,”Completed”)/COUNTA(N2:N100)
Format the cell as a percentage.
How to Create Preventive Maintenance Reminders in Excel?
Add a Next Due Date column and use conditional formatting to highlight overdue tasks. You can also add a helper column that shows “Due Soon” or “Overdue” based on today’s date.
Example:
=IF(P2<TODAY(),”Overdue”,IF(P2<=TODAY()+7,”Due Soon”,”On Track”))
How to Calculate Monthly Maintenance Costs by Equipment?
Use a PivotTable with Equipment in rows and Cost in values. This shows total cost for each asset. It helps identify equipment that needs frequent or expensive repairs.
Can Excel Maintenance Reports Be Linked to Dashboards?
Yes. You can create a dashboard sheet in the same workbook and link it to the main maintenance log. Use formulas, PivotTables, charts, and slicers to show completion rate, total cost, downtime, and overdue tasks.
What’s the Best Template for Small Businesses?
The Basic Monthly Maintenance Tracker is the best starting point. It is simple, quick to fill in, and flexible enough for buildings, small workshops, warehouses, and service teams.
How to Track Overdue Maintenance Automatically?
Add a Next Due Date column and a Status column. Then use this formula to count overdue tasks:
=COUNTIFS(P2:P100,”<“&TODAY(),N2:N100,”<>Completed”)
You can also use conditional formatting to highlight overdue rows.
To Sum It Up
A monthly maintenance report format in Excel helps teams keep repair work, inspections, service dates, costs, and pending tasks in one place. It is useful for buildings, equipment, factories, warehouses, and property management teams.
A good report should include:
- asset or area;
- maintenance type;
- issue;
- action taken;
- technician;
- parts used;
- cost;
- downtime;
- completion date;
- status;
- next due date.
Start with a simple maintenance log sheet Excel file. Add formulas, dropdowns, filters, and a dashboard when the team needs better monthly reporting.
Excel is a good first step. When maintenance data must connect with production, stock, purchasing, and sales, ERP gives better control.