Inventory builds up quietly until it starts getting in the way. One product keeps running out. Another sits untouched. A few haven’t moved in months but still take up shelf space and tie up cash.
If you don’t have a proper method, chances are that you lose track of what’s helping your business move forward and what’s quietly holding it back. FSN analysis is a method: a way to classify stock by how often it moves, so you can focus your decisions where they matter most.
For example, fast-moving items will require constant replenishment. Slow ones will need monitoring. And, non-movers need action.
Time to unpack further on FSN analysis for inventory management, understanding what it is, and how it works for your business.
How Kladana Helps Apply FSN in Daily Inventory Operations
✅ FSN-Based Inventory Tagging — Classify SKUs as Fast, Slow, or Non-moving based on transaction frequency or last movement date to make smarter stocking decisions.
✅ Automated Reorder Logic — Set dynamic reorder points tied to FSN classification so fast-movers get replenished on time while non-movers are paused for review.
✅ Manual Balance Adjustments — Easily adjust stock balances for inactive or excess inventory to reflect real usage and prevent overstocking.
✅ Shelf Space Visibility — Filter and flag slow or dead stock that’s occupying valuable warehouse space, allowing you to repurpose it for high-velocity items.
✅ Usage & Movement Reports — View item-level movement trends over defined periods to identify which SKUs are worth keeping and which need to go.
✅ Procurement & Production Alignment — Sync FSN insights with procurement and production workflows to avoid waste and optimize working capital.
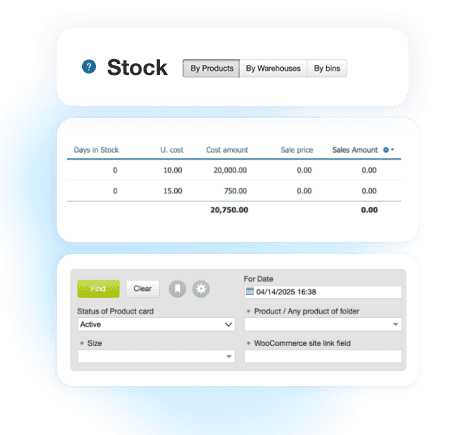
What is FSN: Definition, Example, Full Form, and Category
FSN represents a definitive method for classifying inventory based on the frequency of use or issuance of an item. Businesses adopt FSN to categorize stock in three practical ways that help improve planning and reduce guesswork in daily inventory decisions:
- F — Fast-moving items
- S — Slow-moving items
- N — Non-moving items
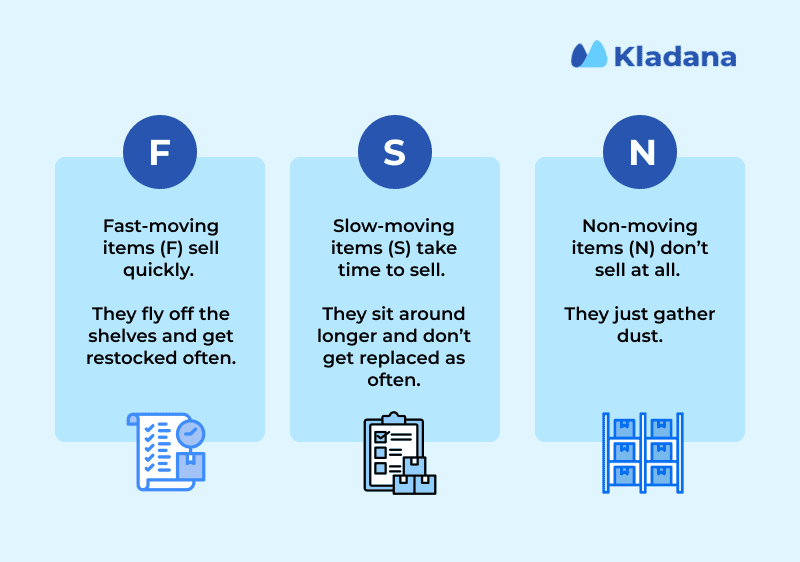
All items are labeled with their frequency of picking and selling within a particular period.
Example:
- A daily use cleaning liquid across shifts = Fast-moving
- One specific-size packaging box for use during promotions only = Moving slowly
- An obsoleted power adapter sitting around with nothing plugged into it for 9 months = Immovable
FSN classification is widely used in finished goods, spares, raw materials, and consumables.
Here’s how FSN is classified.
Fast moving items
These are the products that remain in demand, whether it’s a raw material used every day or a finished product that regularly leaves the shelves. It’s also non-negotiable to have enough of these as they’re huge drivers of lead time and revenue stability.
Use FSN to:
- Increase reorder frequency for these SKUs
- Prevent unplanned stockouts by monitoring issue trends
- Maintain a little more than average in stock to prevent a stop in flow.
Slow moving items
In between are the slow-moving selling items, which sell from time to time because they are still topical. Perhaps it’s packaging for a particular client, or something you work with four times a year, or even products you make in very small batches, as they are more seasonal.
What they need is vision. If you forget these and fail to track them, they silently slip into the non-moving area.
With FSN, you can:
- Track usage over more extended periods
- Decide whether to keep, downsize, or eliminate such products
- Check the shelf space before reordering
Non moving Items
It represents a stock of products that have been inactive for several months. No sales, no transfers, no usage. They sit in storage, occupy space, and tie up cash.
The longer they go unaddressed, the more difficult they are to handle, particularly during audits or stock reviews.
FSN tagging lets you:
- Point and isolate such items quickly
- Trigger liquidation, write-offs, or markdowns
- Free up space for stock that brings revenue
FSN Analysis Example
Let’s say you track item usage over a 6-month period.
Here’s what that might look like:
| Item Code | Description | Last Issue Date | Movement Frequency | FSN Category |
A101 |
Paper Cartons |
3 days ago |
3–4 times/week |
F |
B205 |
Printer Toner |
18 days ago |
Once/month |
S |
C330 |
Cable Ties |
2 days ago |
4–5 times/week |
F |
D920 |
Barcode Scanner |
8 months ago |
None |
N |
E760 |
Rubber Gloves |
6 weeks ago |
Twice/month |
S |
F420 |
Old model charger |
13 months ago |
None |
N |
For businesses in the food industry, where shelf life and daily consumption can shift quickly, tools like Kladana’s food inventory software help automate FSN tagging based on real-time movement history.
That way, slow and non-moving stock never goes unnoticed, even if you’re handling hundreds of SKUs.
Why FSN Matters in Inventory Control
Once you know how frequently each item is moving, your inventory is no longer a game of guesswork. No longer do you order blindly or hoard inventory “just in case.”
FSN brings clarity: it sort of hints at what’s worth keeping, what might deserve a second glance, and what absolutely needs to go.
By grouping products by movement rather than value, this method helps uncover risks that the ABC analysis may not always reveal. There may be bulk purchases from six months ago that just were never taken: FSN brings it to attention.
There can be bulk items ordered six months ago but never moved: FSN highlights it. And then, of course, there may be a handful of fast-selling SKUs, which could be putting your business at a constant risk of stockout: FSN flags that, too.
FSN matters a lot for inventory control because it helps you make the following decisions:
- Do not overstock and stop buying more stock that just sits and doesn’t get moved.
- Ordering the fast-moving products on a time-to-time basis to avoid stockouts of fast-selling goods.
- Root out waste by identifying non-movers that reveal where money is getting stuck. You can re-purpose them, sell them, or write them off.
- Get better use out of our shelf space. Your warehouse will be filled with the more profitable items once you know which ones deserve to stay there.
- Refine reorder decisions as well, knowing that, rather than just guessing or working with outdated reorder points, you’re looking at actual usage.
To make FSN work in practice, you need the right systems tracking movement, highlighting trends, and flagging what needs attention.
Kladana gives you just that, with features that support smart, usage-based stock control.
Categorize Stock | Movement Or Transaction Date
Start sorting items into categories: F, S, or N. This way, you can analyze either the stock’s transaction count or the recency of its last issue.
- Transaction frequency: Track the number of times an item is picked or issued within a specified time frame (e.g., 6 months).
Example cut-offs:
▪ 20+ times ~ Fast
▪ 5–19 times ~ Slow
▪ Less than 5 times ~ Non-moving
- Last movement date: Alternatively, look at when each item was last issued.
Sample logic:
▪ Used within the last 30 days ~ Fast
▪ Used within 1–3 months ~ Slow
▪ Not touched in 6+ months ~ Non-moving
Here’s a simple inventory split visual that teams often use as a reference:
| FSN Category | Percentage of Inventory | Inventory Occupied |
Fast-moving |
~60% |
██████████ |
Slow-moving |
~30% |
██████ |
Non-moving |
~10% |
██ |
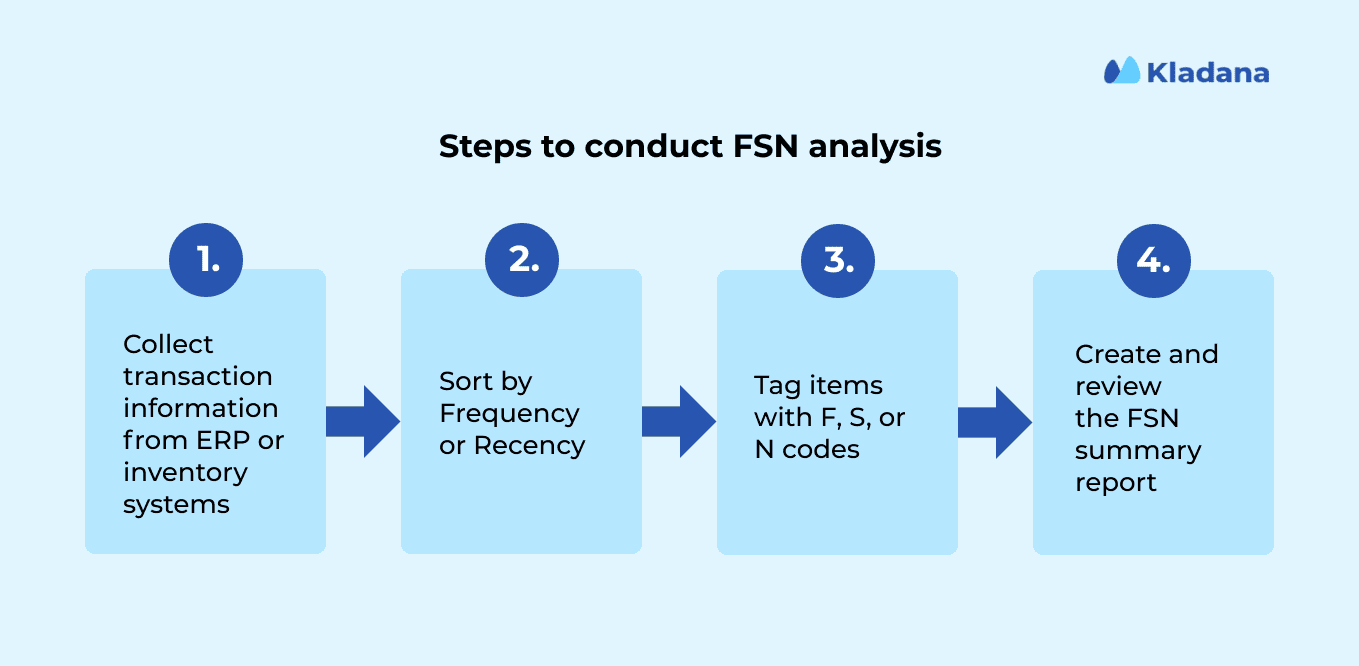
How to Conduct FSN Analysis
FSN analysis would require teams to analyze the movement of stocks over time and classify items.
Below, we’ve featured a concise explanation of each step.
1. Collect transaction information from ERP or inventory systems
The first step is to get a detailed record of how often each SKU has been used, picked, issued, or sold over a chosen period. Six months is common, but if your sales cycle is seasonal or longer, stretch it to a year of data. What you want is a window wide enough to capture real patterns.
Gather for each of these items from your ERP analytics.
- Item code and name
- Dates when it was moved (sold, issued, transferred)
- Number of movements in the time frame
- Most recent movement date
2. Sort by Frequency or Recency
Now that you have the data, the next step is to categorize. However, there are two valid approaches, and the correct one depends on your business type.
A. Frequency
Perfect for high-volume SKUs. You count how many times each item moved over the period.
Below is a sample threshold for each category:
- 20+ movements ~ Fast (F)
- 5–19 movements ~ Slow (S)
- <5 movements ~ Non-moving (N)
B. Recency
Better for slow movers, spares, or made-to-order items. You use the last movement date to judge relevance.
- Used in the last 30 days ~ Fast
- Used in 1–3 months ~ Slow
- No activity in 6+ months ~ Non-moving
Pro tip: You can also combine both as mentioned below in a matrix.

Frequency for fast movers and recency for dormant or specialty stock.
3. Tag items with F, S, or N codes
It’s where raw movement data gets turned into operational clarity. Once you’ve finished setting your frequency or recency thresholds, every product in your master list must be accurately and traceably labeled as Fast (F), Slow (S), or Non-moving (N).
This tagging must be consistent across your system, filterable, and ideally: queryable by teams working in procurement, warehouse ops, and finance.
A. If you’re working in spreadsheets (Excel or Google Sheets)
Use conditional logic (IF formulas or CASE statements) to automate tagging based on your threshold rule.
=IF (Movements>=20,”F”, IF (Movements>=5,”S”,”N”))
Include a ‘Last FSN Review Date’ column for auditability and reporting tracebacks later.
Add filterable columns like:
- FSN Code
- Movement Count
- Last Issue Date
- SKU Category or Department
- Responsible Buyer or Planner
B. If you’re using an ERP like Kladana
Skip manual tagging and apply logic directly in your item master or movement module.
Kladana works out the online inventory management process for generating FSN reports. You can auto-flag stocks with low velocity and run bulk actions, such as markdowns or clearance.
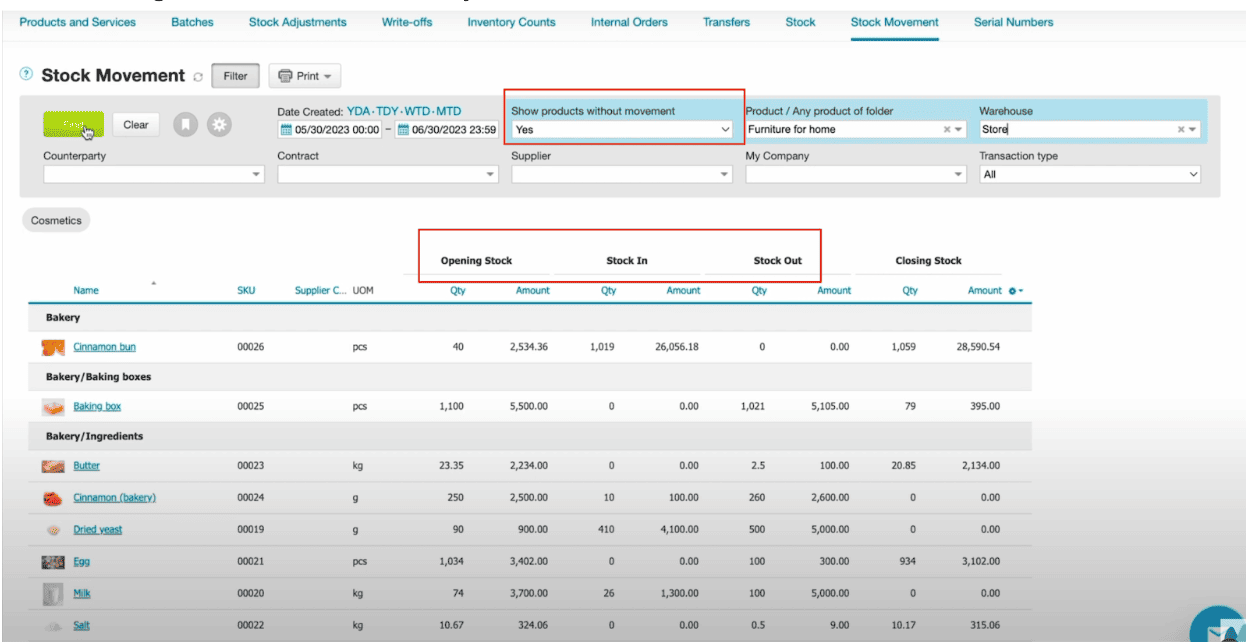
To do this cleanly:
- Set up FSN as a custom field under each product listing.
- Use your ERP’s workflow or automation rules to classify items weekly/monthly based on either:
- Total transaction count
- Days since last transaction
Kladana enables you to define triggers or thresholds that automatically run tagging rules. For example, “if movement count <5 and last transaction >180 days, label N.
You can also:
- Assign FSN at warehouse level if the same SKU moves differently in different regions.
- Add tagging logs or comments, especially for manually overridden labels.
4. Create and review the FSN summary report
Once you tag the SKUs, create a report. The focus should be on reviewing it to make sure that there are no miscalculations. And then comes the way your teams use this data to make informed stocking decisions, layout changes, and cost savings.
Essentially, you’ll have a summary showing the number of SKUs in each FSN group, their percentage share, and the total value, if applicable.
For example, managing a manufacturing setup can benefit from FSN tagging in terms of batch tracking, work orders, or multiple warehouses.
A centralized dashboard like Kladana’s manufacturing inventory software helps generate FSN summaries per plant, monitor idle raw materials, and catch slow-moving WIP before it clogs production flow.
Want to have a quick start at the FSN inventory report? We’ve got you covered with ready to use template.
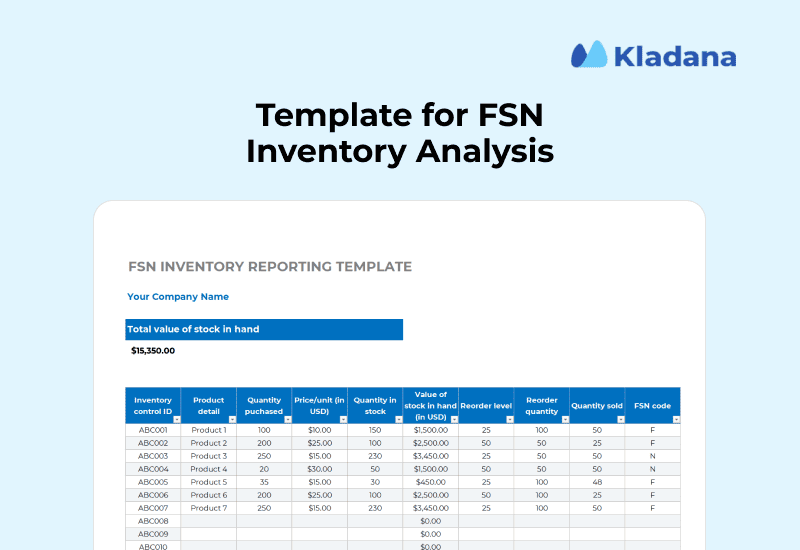
Follow the links below to access the FSN classification template in:
Advantages of Using FSN Analysis in Inventory Management
Once you know how frequently each item actually circulates, your inventory is no longer a guessing game. FSN tells you what’s worth hanging on to, what deserves another look, and what you should simply toss.
1. More profitable decisions around stock reordering
It all begins with knowing the products and their movements. By labelling the FSN, you can eyeball the stocking velocity (which indicates how fast products leave store shelves and end up in your buyers’ hands) and evaluate where your working capital is being used wisely.
Better decisions around stocks will help:
- Prioritize replenishment for high-velocity items that drive revenue
- Defer or halt reorders of SKUs showing prolonged inactivity
- Customize minimum and maximum levels based on FSN category
2. Low carrying costs across the board
Items that don’t move will incur an additional cost for storage. It’s not a direct cost, but rather something implied by factors such as pallet space, climate control, insurance, or write-down risk.
These low-velocity items are precisely the type of things FSN analysis can warn you about, so that you can take action before your costs multiply.
The lower cost is a result of:
- Lower shelf load: You get to isolate SKUs with sub-threshold movement over 90 days
- Avoid restocking: Items that consistently decline in demand are not restocked, so they don’t incur additional costs.
- Space re-invested: retaining the warehouse and on-floor space for fast-turning, high-throughput SKUs that drive ROI.
3. Streamlined Audits
Audits are significantly quicker, clearer, and more targeted when you tag everything according to its activity status. FSN delivers an infrastructure that auditors can leverage from day one, helping to minimize friction in your compliance path.
Extension of these benefits is:
- Less time reconciling non-movers or non-relevant SKUs
- Enhanced visibility and audit trails for active inventory movements
4. More Focused Reordering
Instead of bulk purchase orders, FSN allows you to rank based on priority. The fast-movers are what you spend your reorder budget on.
Everything else is put on hold, either monitored or phased out. These are the operational benefits:
- Avoid stockouts by closely monitoring ‘F’ items
- Allow more liberal reordering triggers for the items that follow an ‘S’ item (s)
- Avoid auto-reordering N items unless there’s a planned use
Want to Simplify Inventory with FSN Analysis?
With Kladana, you can automate FSN tagging, get real-time movement insights, and stop guessing what to reorder or clear out.
FAQs on FSN Analysis
A few common questions about FSN analysis for inventory management — answered!
What does FSN stand for in inventory?
FSN stands for Fast-moving, Slow-moving, and Non-moving items. It’s a way to group your inventory based on how frequently each product is used, sold, or moved.
Under FSN, how do you categorize products?
You can group the FSN by either of the transaction frequency fields or the date of the last movement.
What is the major goal of an FSN analysis?
The objectives of FSN analysis are to ensure proper inventory control and ensure that the firm’s inventory quality aligns with the market movement of its items.
How often should FSN be done?
You would ideally review FSN every month or before each purchasing cycle. The more volatile your stock, the more often you should do the calculation.
Is FSN only for finished goods?
No. That applies in raw, WIP, in packaging, spares, and also in finished goods, where the usage pattern is of material significance.
How is FSN distinction different from ABC analysis?
ABC ordering categorizes stock into three categories: high (A), medium (B), and low value (C) based on cost value. FSN analysis, in contrast, looks at how frequently items are used or sold — fast, slow, or not at all.
Can we configure FSN to work through ERPs?
Yes, ERPs such as Kladana do allow autosuggest based on movement data, and even give you the flexibility to set up thresholds and conduct periodic reviews.
What happens to non-moving inventory?
Items will usually be tagged for review to start either liquidation, bundling, donation, or write-off.
What’s an example of FSN analysis?
Here’s one example of FSN:
- SKU101 (sellotape) − picked 30 times = Fast
- SKU205 (seasonal decor) − picked 6 times = Slow
- SKU309 (old model charger) − no sales = Non-moving
How can FSN save warehouse costs?
Idle stock is dead money that occupies shelf space, hinders working capital, and results in rising costs of ownership, such as insurance, climate control, or maintenance.
