Designing a reliable inventory management system starts with clarity. And that clarity comes from your database structure.
And that’s where you’d need ER diagrams (ERD).
With an ER diagram, system architects, developers, and consultants map out how the inventory data flows, what relationships matter, and how records are stored and retrieved.
Developers building stock systems or consultants evaluating backend logic can use an ER diagram for the inventory management logic blueprint. A well-structured ERD removes speculations and makes it easier to handle transactions, stock adjustments, supplier records, and everything in between.
Read on further to discover what you need to model inventory systems with ERDs, what entities to include, and how to structure relationships that mirror real-world stock movement.
- What is an ER Diagram?
- Core Entities in Inventory Management System
- How Inventory Entities Interact: Key Relationships
- ER Diagram for Inventory Management System: Example Layout & Structure
- ER Diagram for Stock Management System
- Structuring Inventory with Kladana’s ER-Based Approach
- Best Practices for Drawing ER Diagrams
- FAQs
- List of Resources
What is an ER Diagram?
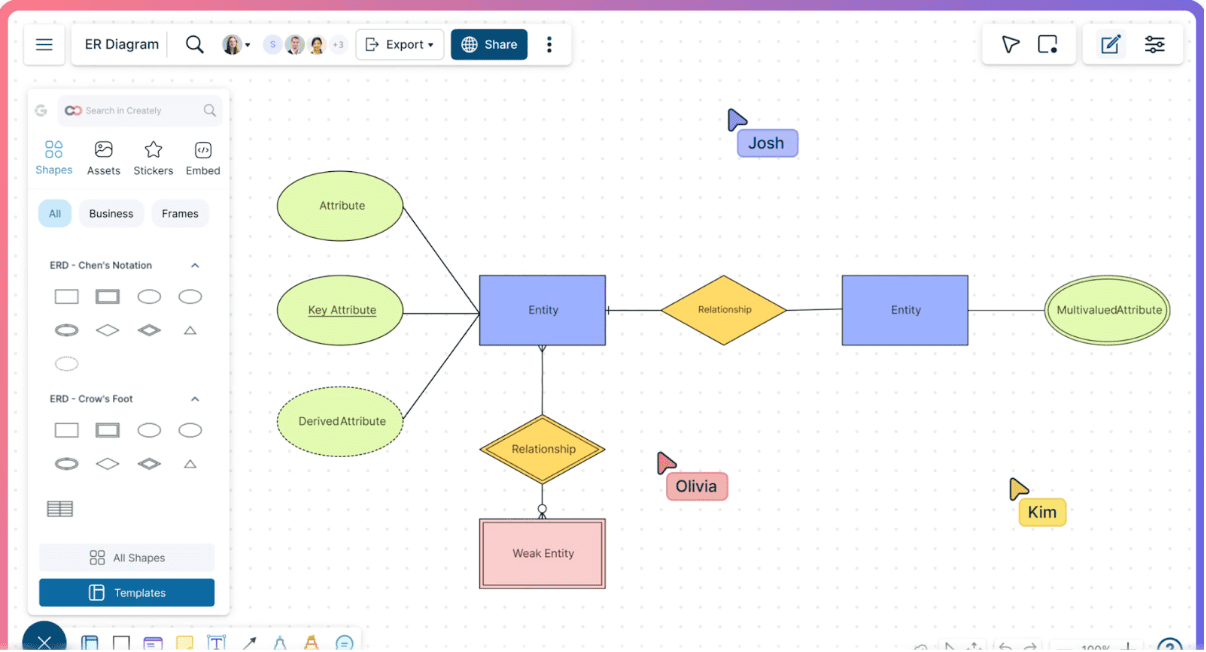
An Entity-Relationship (ER) diagram is a type of data modeling chart that represents the logical structure of a database. It shows how entities (like products or customers) relate to each other in terms of business logic.

When designing a database from scratch for something dynamic like inventory, you need ER diagrams to think through connections and data dependencies.
Here’s what makes up an ER diagram:
Entities
Entities are real-world objects or concepts that have data stored about them. It could be:- Product
- Customer
- Supplier
- Sales Order
- Purchase Order
Attributes
These define properties of each entity, such as:- Product ID
- Product Name
- Unit Cost
- Reorder Level
Relationships
In an ER diagram, relationships represent how entities interact. For example, the supplier providing products, the customer placing orders, etc.
With these three components, ER diagrams help structure relational databases that align with real-world inventory workflows. For developers building stock systems, or consultants evaluating backend logic, an ER diagram for inventory management acts more than a visual; it’s your logic blueprint.
A well-structured ERD removes speculations and makes it easier to handle transactions, stock adjustments, supplier records, and everything in between.
Core Entities in Inventory Management System
Every inventory management system is made up of key elements that define what you’re tracking and how it flows. These core entities are the building blocks of the database, representing all the people, items, and processes involved in stock movement.

Let’s break them down:
Product
The core part of your inventory system includes:- Product ID (Primary Key)
- Name
- Category
- Unit (e.g., pcs, boxes)
- Cost
- Quantity
Supplier
Suppliers provide the stock, for which you’d record- Supplier ID
- Name
- Contact Info (Phone, Email)
- Address
Purchase Order
When ordering new stock, you’d create a purchase order that tracks what was ordered, from whom, and when:- PO ID
- Product ID (Foreign Key)
- Supplier ID (Foreign Key)
- Quantity
- Order Date
Sales Order
It’s an entity representing customer purchases, and each of these includes:- Sales Order ID
- Product ID (Foreign Key)
- Customer ID (Foreign Key)
- Quantity
- Sale Date
Stock
It shows a live reflection of inventory levels that you need to track:- Product ID
- Current Stock Level
- Reorder Level
Customer
They are the recipient of sold goods and include basic customer information such as:- Customer ID
- Name
- Contact
Recommended read: Inventory Management Basics: Techniques, Challenges, Best Practices, and Trends — Study the key element of inventory management
How Inventory Entities Interact: Key Relationships
Inventory systems factor in the data that’s stored and also how they are linked. Understanding entity relationships gives an idea about how data flows across your system.
Most inventory databases operate through one-to-many or many-to-one relationships that help manage orders, track movement, and analyze patterns effectively.
Here’s a breakdown of the most common relationships:
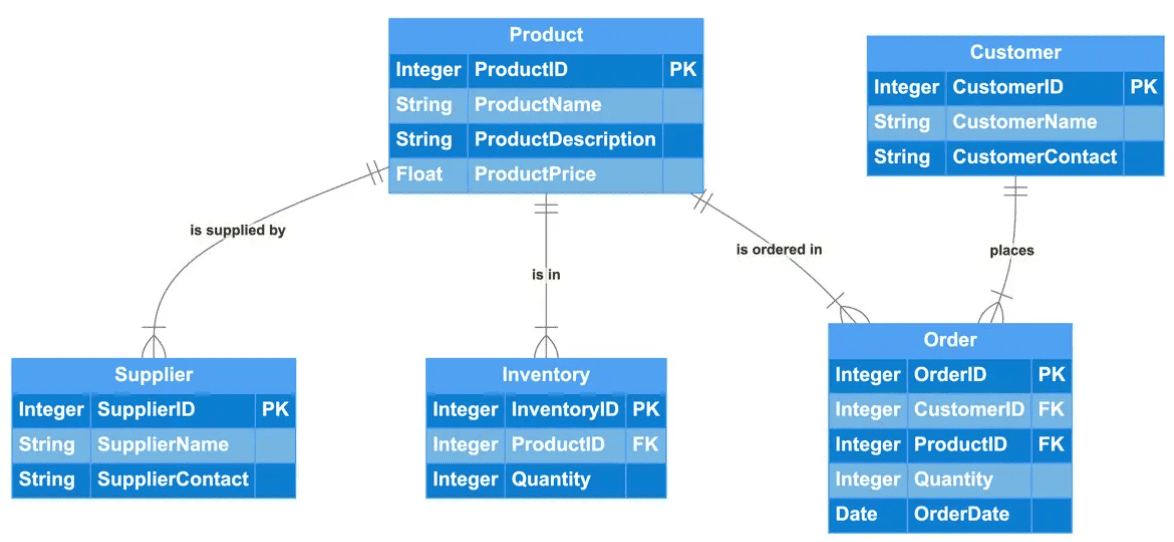
One Supplier >> Many Products
Each supplier can supply multiple products, but a single product usually comes from one preferred supplier.
Type: One-to-Many
Implementation: Foreign key Supplier ID in the Product entity.
One Product >> Many Sales Orders
A product can be sold multiple times, appearing in several orders.
Type: One-to-Many
Implementation: Product ID as a foreign key in the Sales Order table.
One Customer >> Many Sales Orders
A single customer can place multiple orders. Each order refers back to a customer.
Type: One-to-Many
Implementation: Customer ID in the Sales Order table.
Here’s a table for better understanding:
| Relationship | From Entity | To Entity | Type |
Supplier to Product |
Supplier |
Product |
One-to-Many |
Product to Purchase Order |
Product |
Purchase Order |
One-to-Many |
Product to Sales Order |
Product |
Sales Order |
One-to-Many |
Customer to Sales Order |
Customer |
Sales Order |
One-to-Many |
ER Diagram for Inventory Management System: Example Layout & Structure
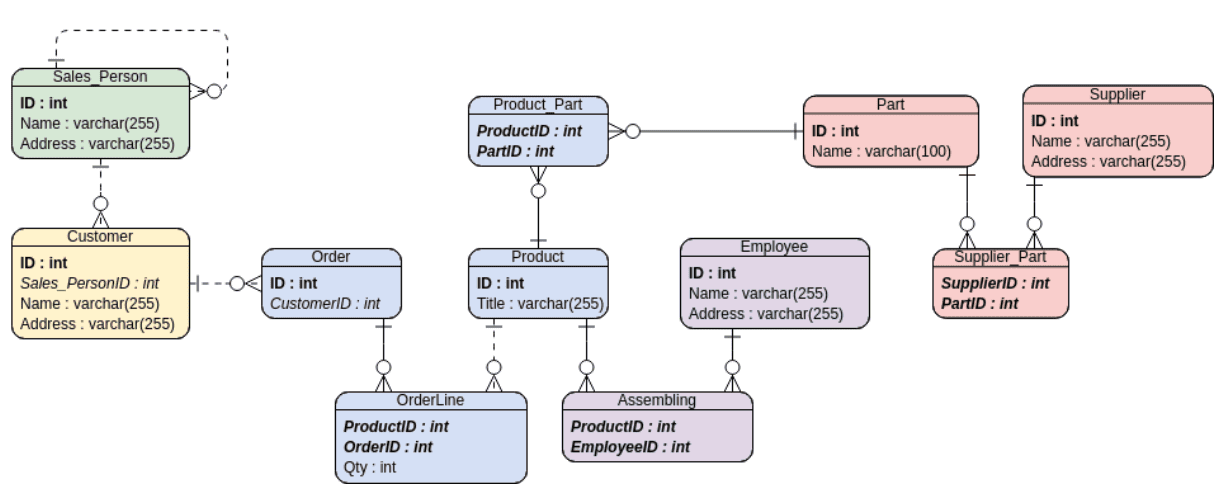
Below is a sample ER diagram for an inventory management system, showing how key entities like Product, Supplier, Purchase Order, and Sales Order connect.
Such a layout reflects a real-world inventory system where purchasing, stock levels, and customer orders are tightly linked.

For starters, you can visit Visual Paradigm and create a sample ER diagram. Alternatively, you can also use Creately, Lucidchart, and more.
Once your ERD is finalized, the next logical step is translating this structure into a working backend. This is something that an online inventory management software like Kladana can help execute through real-time purchase, sales, and stock tracking.
Understanding the ER Diagram Layout
The above diagram displays the Entity-Relationship Diagram modeling a manufacturing and sales-focused inventory system. It captures both stock structure (parts, products, suppliers) and transactional flows (orders, customers, sales reps).
The design reflects real-world logistics for businesses assembling products from parts and tracking orders through multiple relationships.
Key Entities and Their Purpose
The diagram mentions the following key entities and the purpose they serve.
Product
- ID, Title
- Linked to OrderLine (sales) and Assembling (production)
Part
- ID, Name
- Supplied by vendors and tied to products via Product_Part.
Supplier
- ID, Name, Address
- Linked through a many-to-many relationship with Part via Supplier_Part.
Product_Part
- ProductID, PartID
- Essential for Bill of Materials (BoM) logic.
Operational Entities
The following entities exist due to operational reasons.
Employee
- ID, Name, Address
- Related to the Assembling table, showing which employee assembled what product.
Assembling
- ProductID, EmployeeID
Customer-Facing Entities
There are also customer-facing entities in the diagram in the form of the following data:
Customer
- ID, Name, Address, Sales_PersonID
- Tied to Sales_Person via a foreign key.
- Has many Order records linked through CustomerID.
Sales_Person
- ID, Name, Address
- Provides a human layer to B2B or B2C relationships.
Order
- ID, CustomerID
- Each order contains multiple OrderLine items.
OrderLine
- ProductID, OrderID, Qty
- Classic order-item relationship table, suitable for detailed invoice generation.
ER Diagram for Stock Management System
A stock-focused ER diagram provides a closer look at internal availability and tracking. Unlike full inventory ERDs that handle suppliers, sales, and orders, this one zeroes in on what’s in stock, where it’s stored, and when it needs replenishment.
The core entity is Stock, with fields like current quantity, reorder thresholds, safety levels, and restock triggers.
For distributed operations, a Warehouse entity defines where stock sits, helping map quantity by location, bin, or zone.
Incorporating entities like Stock_Adjustment and Warehouse ensures your diagram mirrors operational needs. Now, this is something super important if you want to manage your stock efficiently and reduce inventory blind spots.
Stock Adjustment Entity and Its Purpose
Fluctuations are out of bounds in every real-time stock system. It could be due to items getting returned, damaged, or misplaced.
That’s why a dedicated Stock Adjustment entity is essential. This table logs each update outside the usual purchase and sale cycle.
It captures:
- Adjustment type (e.g., shrinkage, manual correction)
- Timestamp
- Item affected
- Adjusted quantity
- Reason or source
Tracking these events adds transparency to stock movement and provides clean audit trails that enable reconciling system data with physical counts.
Structuring Inventory with Kladana’s ER-Based Approach
Behind every inventory action is a relationship between products, suppliers, orders, and customers. Kladana mirrors these real-world connections using a system that reflects ER diagram principles.
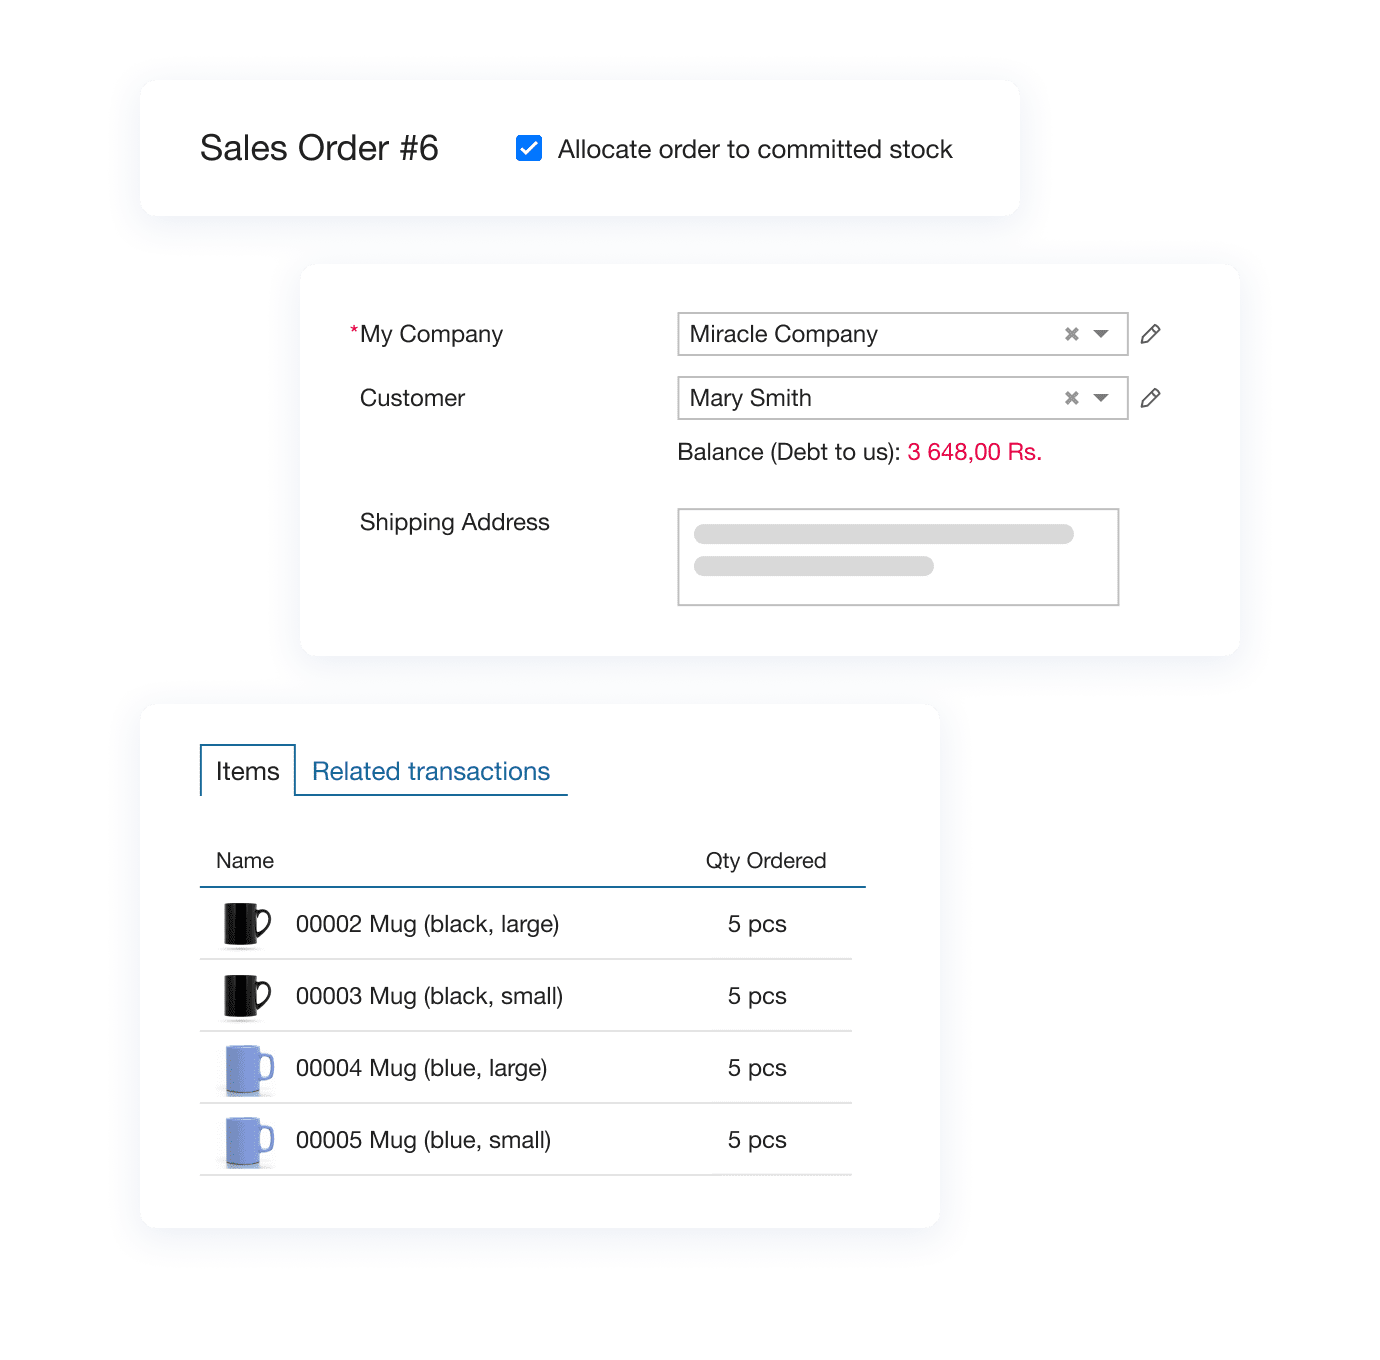
Every product entry links to supplier records, purchase orders update stock levels in real time, and sales orders are tied directly to customer data. This structure keeps your inventory accurate, traceable, and easy to manage. Instead of juggling isolated data points, you get a system where everything connects just like it should.
📍 Ready to try ERP system to automate your inventory? Check out our comprehensive guide — ERP Inventory Management — How to Control Stock Efficiently in 2026
Best Practices for Drawing ER Diagrams
Even a simple diagram can become difficult to interpret if the basics are overlooked. So, it’s best to adhere to some of the best practices for drawing ER diagrams to stay usable and developer-ready.
Name what matters
Field and entity names should describe the content directly. Use ProductID, not P_ID, because good naming reduces guesswork when multiple systems or developers work with your schema.
Keep structures lean
Avoid repeating data across tables. Instead, keep it in one place, for instance, at the source entity, and reference it using foreign keys. For example, the supplier’s address should live in the Supplier table, not repeated in every order.
Use join tables smartly
Whenever two entities relate in multiple ways (e.g., one Product can have many Parts, and one Part goes into multiple Products), use a join table like Product_Part. This will keep your schema scalable and avoid column-level complexity.
Maintain one direction of flow
ERDs should show logical movement from order creation to fulfillment or from stock input to stock depletion. It’s one way to turn your ERD from a tech artifact into a communication asset for both dev and ops teams.
Use separate tables for adjustments
Manage stock changes better by creating a dedicated table for edits makes the system transparent and easy to audit. For example, a dedicated StockAdjustment table lets you capture returns, breakage, or inventory audits cleanly, without polluting sales or purchase data.
FAQs
Now, let’s address some of the common questions to simplify the understanding of the ER diagram.
What are the key entities in an inventory ER diagram?
Typically: Product, Stock, Supplier, Purchase Order, Sales Order, Customer, and optionally Warehouse.
Can one diagram handle both sales and stock?
Yes. A unified diagram gives visibility across inventory, transactions, and enables teams to reduce errors.
What tools are best for drawing ERDs?
Lucidchart, Draw.io, Creately, and Visual Paradigm offer a good balance between visual control and export options.
Are inventory and stock diagrams different?
Inventory diagrams map the flow, such as stock levels, purchases, and sales. Stock diagrams emphasize current availability and movements inside the warehouse.
How is stock adjusted in ERDs?
Use a dedicated Stock Adjustment entity. This records events like manual edits, returns, or inventory checks.
Does this model support warehouse-based planning?
Yes. Add a Warehouse table and link stock records to it with a foreign key.
Can I convert ERDs into tables easily?
Once you define keys, relationships, and field types, conversion into relational tables is straightforward, with most tools supporting schema exports.
How do I make this fit my business?
Start with the base model, then customize entities or add new ones like Batches, Returns, or Shipment Tracking, depending on how your operation runs.
What’s the best tool to draw an ER diagram quickly?
For developers, Lucidchart, dbdiagram.io, or drawSQL work well. For teams working in app ecosystems, Visual Paradigm, Creately, or Microsoft Visio offer deeper integrations.
Can I include warehouse locations and batch numbers in my ER diagram?
Yes. If your inventory system tracks batches or multiple warehouses, create additional entities like Warehouse and BatchDetails, and link them to Stock or Product.
Keep Your Inventory Data Connected and Easy to Track
Kladana maps products, suppliers, and orders in one system for accurate tracking and faster decision-making.
List of Resources
Visual Paradigm — ER Diagram: Inventory Management System


